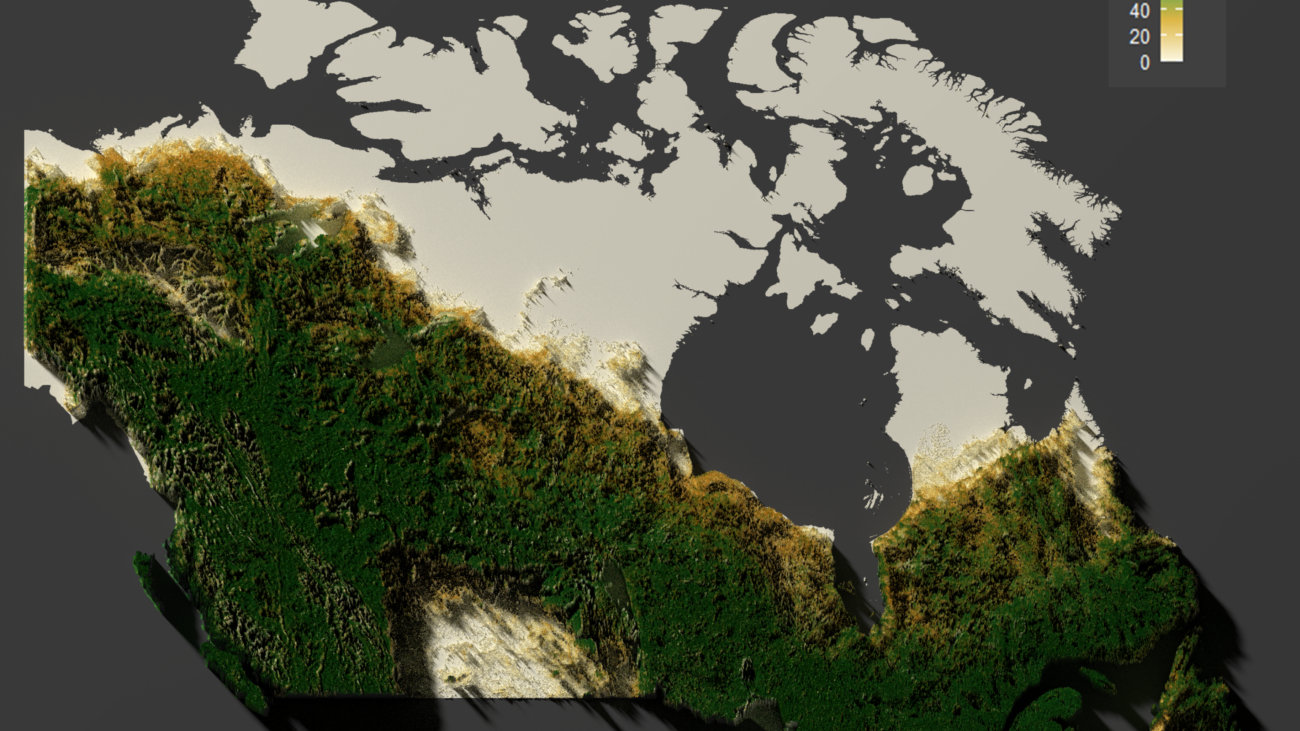
At Burbaks GIS Consultancy, we’re passionate about turning complex data into visually stunning and meaningful insights. Recently, our team created a captivating 3D map of Canada’s forests using innovative tools and techniques. This map highlights the diversity of forest density across Canada while showcasing how modern technology can breathe life into geospatial data.
The Vision
Canada is home to some of the most extensive and diverse forests in the world. We set out to create a 3D map that not only captures this natural beauty but also serves as a powerful tool for understanding forest density and elevation. Our goal was simple: to turn raw data into a breathtaking visual experience accessible to everyone.
The Tools We Used
To bring this project to life, we turned to open-source software and creative visualization tools. These included:
- R Programming: A versatile language for data analysis and visualization.
- ggplot2: A popular tool for creating elegant 2D maps and graphs.
- rayshader: A powerful library that transforms flat 2D visuals into stunning 3D renderings.
Together, these tools allowed us to integrate forest cover and elevation data into a cohesive and interactive 3D map.
How We Did It
- Data Collection
We began by sourcing two types of data: forest density, which represents the percentage of land covered by forests, and elevation, which adds the third dimension to our map. These datasets were obtained from public repositories to ensure accuracy and transparency. - Data Preparation
Before creating the map, we carefully processed the data to align the forest density and elevation layers. This step was crucial to ensure every detail in the map reflected the real-world terrain and forest coverage. - Building the 2D Map
We started with a flat, 2D visualization to explore the forest density patterns. Using intuitive color gradients, we highlighted areas with sparse, moderate, and dense forest cover, setting the stage for the 3D transformation. - Bringing the Map to Life in 3D
The magic happened when we used rayshader to add depth and texture. By incorporating elevation data, we created realistic terrain that made the forests “pop” off the map. The addition of lighting and shadows brought a lifelike quality to the visualization, making it feel as though you could walk through Canada’s wilderness. - Enhancements and Finishing Touches
To ensure the map was both beautiful and informative, we added fine details like water features, realistic lighting, and interactive elements that allow viewers to zoom and rotate the map.
The Final Product
The result was a vibrant, interactive 3D map that showcases the beauty of Canada’s forests like never before. Viewers can explore regions from the Rocky Mountains to the boreal forests of Ontario, gaining a new appreciation for the diversity and scale of these natural landscapes.
Why It Matters
This project isn’t just about aesthetics. By visualizing forest density in 3D, we can:
- Better understand how forests are distributed across Canada.
- Identify areas that may require conservation efforts.
- Provide a tool for education, research, and policymaking.
Interactive maps like this one make complex data accessible to a wider audience, fostering a deeper connection to our natural environment.
Looking Ahead
At Burbaks GIS Consultancy, we believe this is just the beginning. Our future projects aim to incorporate real-time updates and additional environmental data, such as biodiversity metrics and carbon sequestration potential. Our vision is to use cutting-edge geospatial technology to drive positive environmental change.

