CanadaForest2

Creating a 3D Map of Canada’s Forests: A Behind-the-Scenes Look at Burbaks GIS Consultancy’s Latest Project

Spread the love

At Burbaks GIS Consultancy, we’re passionate about turning complex data into visually stunning and meaningful insights. Recently, our team created a captivating 3D map of Canada’s forests using innovative tools and techniques. This map highlights the diversity of forest density across Canada while showcasing how modern technology can breathe life into geospatial data.


The Vision

Canada is home to some of the most extensive and diverse forests in the world. We set out to create a 3D map that not only captures this natural beauty but also serves as a powerful tool for understanding forest density and elevation. Our goal was simple: to turn raw data into a breathtaking visual experience accessible to everyone.


The Tools We Used

To bring this project to life, we turned to open-source software and creative visualization tools. These included:

  • R Programming: A versatile language for data analysis and visualization.
  • ggplot2: A popular tool for creating elegant 2D maps and graphs.
  • rayshader: A powerful library that transforms flat 2D visuals into stunning 3D renderings.

Together, these tools allowed us to integrate forest cover and elevation data into a cohesive and interactive 3D map.


How We Did It

  1. Data Collection
    We began by sourcing two types of data: forest density, which represents the percentage of land covered by forests, and elevation, which adds the third dimension to our map. These datasets were obtained from public repositories to ensure accuracy and transparency.
  2. Data Preparation
    Before creating the map, we carefully processed the data to align the forest density and elevation layers. This step was crucial to ensure every detail in the map reflected the real-world terrain and forest coverage.
  3. Building the 2D Map
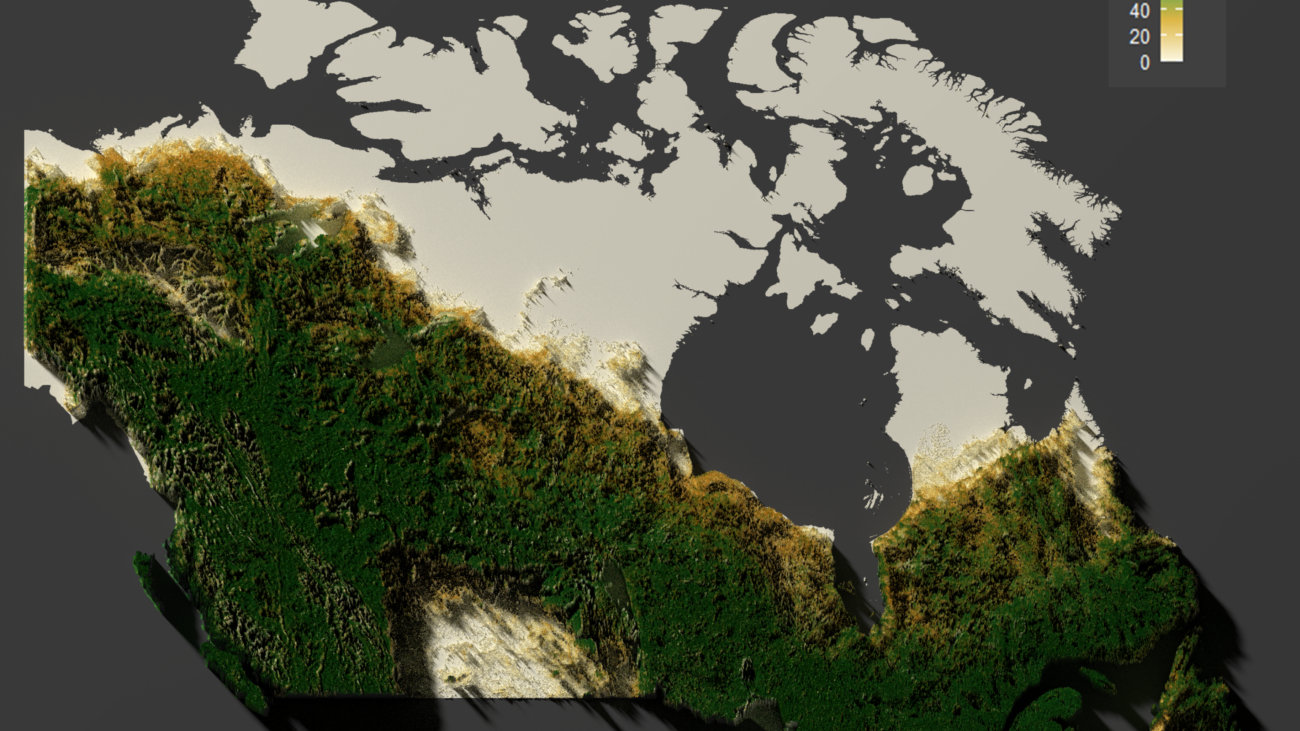
    We started with a flat, 2D visualization to explore the forest density patterns. Using intuitive color gradients, we highlighted areas with sparse, moderate, and dense forest cover, setting the stage for the 3D transformation.
  4. Bringing the Map to Life in 3D
    The magic happened when we used rayshader to add depth and texture. By incorporating elevation data, we created realistic terrain that made the forests “pop” off the map. The addition of lighting and shadows brought a lifelike quality to the visualization, making it feel as though you could walk through Canada’s wilderness.
  5. Enhancements and Finishing Touches
    To ensure the map was both beautiful and informative, we added fine details like water features, realistic lighting, and interactive elements that allow viewers to zoom and rotate the map.
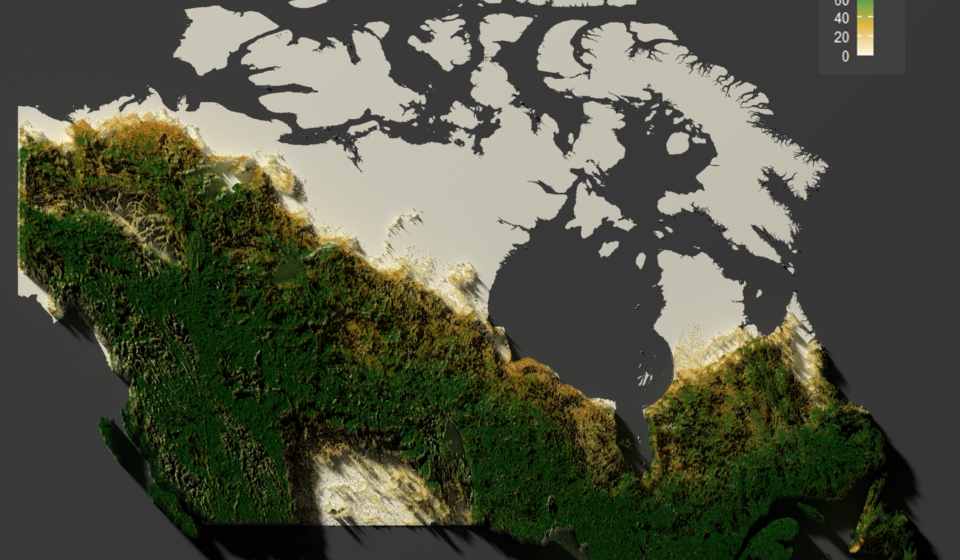
The Final Product

The result was a vibrant, interactive 3D map that showcases the beauty of Canada’s forests like never before. Viewers can explore regions from the Rocky Mountains to the boreal forests of Ontario, gaining a new appreciation for the diversity and scale of these natural landscapes.


Why It Matters

This project isn’t just about aesthetics. By visualizing forest density in 3D, we can:

  • Better understand how forests are distributed across Canada.
  • Identify areas that may require conservation efforts.
  • Provide a tool for education, research, and policymaking.

Interactive maps like this one make complex data accessible to a wider audience, fostering a deeper connection to our natural environment.


Looking Ahead

At Burbaks GIS Consultancy, we believe this is just the beginning. Our future projects aim to incorporate real-time updates and additional environmental data, such as biodiversity metrics and carbon sequestration potential. Our vision is to use cutting-edge geospatial technology to drive positive environmental change.

Capture

Unveiling History: The Creation of Emperor Menelik 3D Model by Burbaks Team

Spread the love

In a groundbreaking fusion of technology and history, Burbaks Team has meticulously resurrected Emperor Menelik II, the revered leader of Ethiopia, through the marvels of 3D modeling. Utilizing the cutting-edge photogrammetry method, coupled with industry-standard software such as Meshroom and Blender, this ambitious project has breathed life into the past, offering a tangible glimpse into bygone eras.

The journey to create the Emperor Menelik 3D model was a labor of love, driven by a passion for historical preservation and technological innovation. The process began with the collection of archival photographs and videos depicting Emperor Menelik II from various angles and perspectives. These visual references served as the foundation for the ambitious endeavor, providing invaluable insights into the physical characteristics and nuances of the revered monarch.

Harnessing the power of photogrammetry, Burbaks Team embarked on a meticulous journey to transform two-dimensional imagery into a three-dimensional masterpiece. Photogrammetry is a technique that extracts geometric data from 2D images to generate 3D models, enabling the recreation of intricate details with astonishing accuracy.

The first step in the process involved converting the video footage into a sequence of high-resolution images, capturing every nuanced detail of Emperor Menelik II’s visage. This meticulous image processing laid the groundwork for the subsequent stages of model reconstruction.

Enter Meshroom, a powerful open-source photogrammetry software that served as the cornerstone of the project. Meshroom employs advanced algorithms to analyze the image sequence, reconstructing the geometry and texture of the subject with unparalleled precision. Through a complex series of computational processes, Meshroom transformed the static images into a dynamic 3D mesh, faithfully replicating Emperor Menelik II in all his regal splendor.

Following the completion of the photogrammetry phase, the journey continued with Blender, a versatile 3D modeling and animation software. In Blender, the raw mesh generated by Meshroom was refined and sculpted to perfection, fine-tuning every aspect of the model to capture the essence of Emperor Menelik II with utmost fidelity. From facial features to intricate attire, each detail was meticulously crafted to evoke a sense of authenticity and reverence.

With the painstaking reconstruction complete, Burbaks Team proudly unveiled the Emperor Menelik 3D model, a testament to the convergence of artistry and technology. This stunning digital replica now stands as a beacon of historical preservation, offering scholars, educators, and enthusiasts alike an unprecedented opportunity to engage with the legacy of Emperor Menelik II.

But the journey does not end there. In a gesture of generosity and collaboration, Burbaks Team has made the Emperor Menelik 3D model available for download on Sketchfab (https://sketchfab.com/3d-models/emperor-menelik-of-ethiopia-7f1d54edb66b445c8ba17aeffe083920) , a leading platform for sharing and exploring 3D content. This decision reflects a commitment to democratizing access to cultural heritage, empowering individuals and institutions to utilize the model for animations, research, or educational purposes.

As the virtual embodiment of a storied past, the Emperor Menelik 3D model invites us to embark on a journey through time, bridging the gap between history and modernity. In an age defined by technological innovation, it serves as a poignant reminder of the transformative power of digital humanities, enriching our understanding of the past and inspiring future generations to preserve and cherish our shared heritage.

landsat

Unlocking Insights: The Impact of Landsat Data on Earth Observation

Spread the love

Landsat satellites have been orbiting Earth for nearly five decades, capturing invaluable data about our planet’s changing landscapes. From monitoring deforestation in the Amazon to tracking urban expansion in megacities, Landsat data plays a crucial role in understanding and managing Earth’s resources. As we delve into 2024, let’s explore the significance of Landsat data and its diverse applications across various domains.

Landsat, a joint program between NASA and the U.S. Geological Survey (USGS), has produced the longest continuous record of Earth’s surface observations from space. With a series of satellites launched since the program’s inception in 1972, Landsat has provided a wealth of multispectral imagery, covering every corner of the globe at a resolution suitable for detecting changes over time.

One of the primary applications of Landsat data is in land cover and land use mapping. By analyzing spectral signatures across different wavelengths, researchers can classify different types of land cover, such as forests, croplands, water bodies, and urban areas. This information is invaluable for land management, biodiversity conservation, and urban planning efforts worldwide.

Landsat data also plays a crucial role in monitoring environmental changes, including deforestation, desertification, and glacier retreat. Scientists leverage Landsat imagery to assess the extent and impact of these changes, helping policymakers develop strategies for mitigating environmental degradation and adapting to climate change.

Moreover, Landsat data is instrumental in agriculture, providing insights into crop health, yield estimation, and water management. By analyzing vegetation indices derived from Landsat imagery, farmers can optimize irrigation practices, detect pest infestations, and monitor crop growth throughout the growing season.

In addition to its scientific applications, Landsat data is also used for disaster response and recovery. During natural disasters such as wildfires, floods, and earthquakes, Landsat imagery provides valuable information for assessing the extent of damage, identifying vulnerable areas, and planning emergency response efforts.

Furthermore, Landsat data supports international initiatives such as the Sustainable Development Goals (SDGs), providing essential information for monitoring progress towards targets related to climate action, biodiversity conservation, and sustainable land management.

Looking ahead, the Landsat program is poised for continued innovation and expansion. With the launch of Landsat 9 in 2021, the program has entered a new era of advanced Earth observation capabilities, including improved spectral resolution and increased data continuity. These enhancements will further enhance the utility of Landsat data for a wide range of applications, from scientific research to commercial ventures.

In conclusion, Landsat data remains a cornerstone of Earth observation, providing a wealth of information about our planet’s changing surface. From land cover mapping to environmental monitoring, Landsat imagery supports a diverse array of applications with far-reaching implications for sustainable development and environmental stewardship. As we continue to harness the power of Landsat data, we unlock new insights into the dynamics of our ever-changing world.

GIS-Specialist

The Rapid Growth of the GIS Industry: Transforming Data into Insights

Spread the love

The Geographic Information System (GIS) industry is experiencing exponential growth, driven by advancements in technology and the increasing demand for spatial data analytics across various sectors. From urban planning to environmental management, GIS has become an indispensable tool for decision-making and problem-solving.

One of the key factors contributing to the growth of the GIS industry is the proliferation of location-based services (LBS) and mobile mapping applications. These technologies leverage GIS data to provide real-time information to users, whether it’s navigating through city streets or finding nearby amenities. As smartphones become ubiquitous, the demand for LBS continues to soar, driving investment in GIS infrastructure and applications.

Furthermore, the integration of GIS with other emerging technologies such as artificial intelligence (AI), Internet of Things (IoT), and big data analytics is expanding the capabilities of spatial analysis. For example, AI algorithms can analyze satellite imagery to identify patterns and trends, helping organizations make informed decisions about resource allocation, risk assessment, and infrastructure development.

Moreover, governments around the world are increasingly recognizing the value of GIS in addressing complex challenges such as disaster management, urbanization, and climate change. As a result, there has been a surge in public sector investment in GIS projects, ranging from mapping vulnerable areas to monitoring air and water quality.

The private sector is also driving growth in the GIS industry, with companies utilizing spatial data to optimize supply chains, enhance marketing strategies, and improve customer experiences. Retailers use GIS to analyze consumer behavior and location-based preferences, enabling targeted advertising and personalized promotions.

As the GIS industry continues to evolve, there are significant opportunities for innovation and entrepreneurship. Startups are developing niche GIS solutions tailored to specific industries, while established players are expanding their offerings to meet the diverse needs of customers worldwide.

In conclusion, the GIS industry is witnessing rapid growth fueled by technological advancements, increasing demand for spatial data analytics, and growing awareness of its potential across various sectors. As organizations continue to harness the power of GIS to gain actionable insights from location data, the industry is poised for further expansion in the years to come.